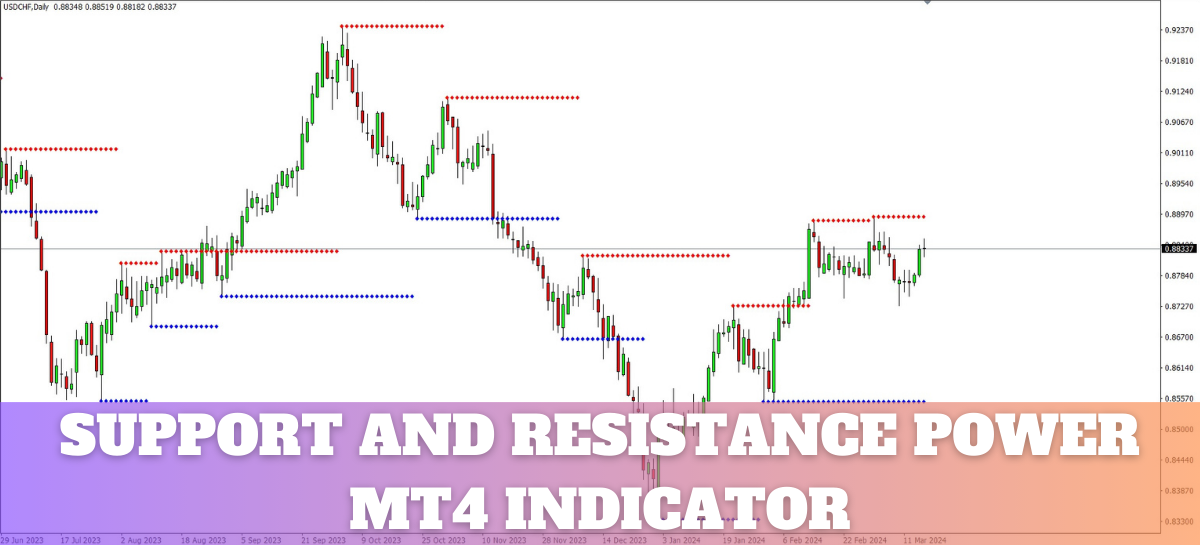
The Murrey Math Time Frame Indicator MT4 is a technical indicator for MetaTrader 4, designed to identify and indicate key support and resistance levels on the main chart. This indicator calculates and draws horizontal lines on the price chart, indicating key support and resistance levels that can signal potential price reversals. It is based on the Murrey math concept developed in the 1990s by T. Henning Murrey. Murrey Math trading is based on the idea that price movements in the market often happen in steps of 1/8. That means price tends to move or bounce at levels like 1/8, 2/8, all the way up to 8/8. These levels act like support and resistance zones, helping traders spot where the price might stop, reverse, or break through.
This indicator splits the price range into 8 key levels, but the most important ones to watch are the 0/8, 4/8, and 8/8 levels. These Key lines include Major Pivotal Point and Ultimate Support/Resistance levels where price often reacts. Additionally, it plots pivot, reverse lines, overshoot lines, extremely overbought and oversold lines, weak stalls, and reverse lines where prices may stall or temporarily reverse. Moreover, the indicator also defines the top and bottom bounds of the trading range. As a result, traders can accurately identify optimal entry and exit points. Furthermore, the indicator is customizable, making it an invaluable asset for traders aiming to identify key support and resistance zones.

This indicator is suitable for traders of all skill levels and across all time frames. It is designed for use with any currency pair and integrates into any forex trading system or strategy to identify key support and resistance levels.
Indicator Settings

How to Install Murrey Math Time Frame Indicator MT4
Download and extract files in the MetaTrader “Indicators” Data Folder found in the Main Menu File section:

The “Indicators” folder is located in the “MQL4” folder.
Restart MetaTrader Platform.